
Dynamic Small Cap Commentary First Quarter 2018
For your review are the 1st quarter 2018 Performance Summary, Market Outlook, and Economic Commentary for the Dynamic Small cap portfolio. During the period, the portfolio returned -1.91%, while the Benchmark (Russell 2000 Growth) total return was 2.30%. Our Quantitative strategy was buffeted by sudden negative macro headwinds and increased market volatility. Despite this, and with increased diligence, we remain confident in our core investment process.
1st Quarter Equity Attribution
As implied, the strategy underperformed its benchmark by 421 bps during the 1st quarter period.
Amongst sectors, positive contribution from the Financials, Healthcare, and Materials sectors was offset by relative underperformance from the Consumer Discretionary, Energy, Information Technology, Consumer Staples, and Industrials sectors.
A 12.64% weighting in the Financials sector accounted for 184 bps of the strategy’s total relative positive contribution during the quarterly period. An average 3.17% position weight in BofI Holding Inc., a Thrift & Mortgage Finance firm, accounted for positive contribution to returns of 93bps. The sector also benefitted from an average 1.21% position weight in Financial Engines Inc., a Capital Markets company, which had a portfolio contribution of 27 bps to the portfolio.
A 13.86% weighting in the Healthcare sector accounted for approximately 109 bps of positive contribution during the quarterly period. A position in TG Therapeutics Inc., a Biotechnology firm, with an average weighting of 0.89% in the portfolio, accounted for positive contribution of 42 bps.
The Consumer Discretionary sector, with a 13.51% weighting in the portfolio had negative contribution of 163 bps. A 1.73% position weight in Gray Television Inc., a Media firm, had negative contribution of 46 bps.
The Industrials sector, with a 23.74% average weighting in the portfolio had negative contribution of 72 bps. A 1.70% position weight in REV Group Inc., a Machinery company, had negative contribution of 71 bps. Also an average 1.72% position weight in Navistar International accounted for negative contribution of 50 bps.
The Consumer Staples sector, with a 4.11% weighting had negative contribution of 141 bps during the quarterly period. An average 2.05% position weight in B&G Foods Inc., accounted for negative contribution of 73 bps. Also an average 1.38% position weight in Dean Foods Company., accounted for negative contribution of 41 bps.
Market Outlook & Trends
The optimism experienced within equity markets during the last year extended into the initial innings of the 1st quarter at an even accelerated pace. This was due to a combination of the enacted tax cut legislation, the repatriation of cash to be used for investment in-country, positive revisions of multiple economic indicators such as a GDP number hovering around 3%. After an initial cautious posture due to uncertainty about legislative and administration policies, uncertainty receded, and the positive trend garnered momentum towards year end 2017 and into the early innings of the 1st quarter.
Investor enthusiasm was relatively broad based – Healthcare, Financials, Industrials and Materials demonstrated strength as the reflation trade continued unabated. The appetite for Technology and Consumer Discretionary stocks carried over from the prior year and was less restrained. The Energy sector saw an onset of the withdrawal season with Natural gas working storage below the 5 year average. This, combined with a below normal winter season and historic Natural Gas withdrawals, drove up higher returns in gas related energy stocks. The benefits of restrained OPEC production as well as increasing global demand for crude products continued as Crude supply at 97.8 million barrels/day fell below global demand at 99.8 million barrels/day. .
As expected, the Federal Reserve increased the federal funds rate in the 1st quarter and continues to signal more rate cuts in 2018 despite the absence of significant headline, core, and wage inflation- this low inflationary environment unaffected by improving global economic activity, and successful tax reform legislation passed through Congress and approved by the Trump administration.
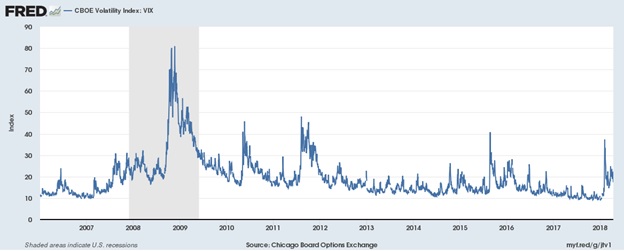
Thus as the quarter proceeded, the equity markets appeared to be discounting a range of potential pro-growth fiscal policies, continued deregulatory actions, continued corporate earnings growth, looser than expected global monetary policy, and global economic growth. Volatility as measured by the CBOE Volatility Index VIX fell close to 9.00. Among major geographies, the U.S. economy continued to be quite stable. The pro-growth legislative actions proposed by the administration drove overall positive sentiment.
Economic growth within the EU continued as concerns about Brexit receded and resolution of the issue beneficial to both sides came to the forefront. Conditions in Asia also were in a positive trajectory with China, Japan, and India meeting growth projections. So, both U.S. centric and international centric foci offered attractive growth prospects on an absolute basis.
Thus the quarter began with high investor optimism, moderate Inflation data, looser than expected global monetary policy, low unemployment data, relatively weak U.S. dollar, strong global GDP growth, enacted tax reform and deregulation in the US, and positive S&P 500 earnings prospects.
Volatility roared back mid quarter though primarily due to tariff proposals on steel and aluminum imports as well as others initiated by the administration, targeted against China, but which induced fears of a wider global trade war. Also further monetary tightening by the FED via interest rate hiking raised concerns about the negative implications for equities.
U.S. Economic Commentary
The fiscal stimulus provided by the Federal government added to an already strong global growth momentum. The enacted tax cuts, global economic growth, a full employment economy, and strong corporate earnings are tailwinds for equities going forward. U.S. corporate EPS is forecasted to grow nearly 20% with approximately 5% of this growth attributable to the impact of the reduction in tax cuts. The two-year budget deal signed in February allows for large increases in discretionary government spending in 2018 and 2019 further adding an economic boost.
These factors continued as dominant themes during the 1st quarter. Real GDP increased at an annual rate of 2.9% in the 4th quarter of 2017 according to the "3rd" estimate released by the Bureau of Economic Analysis. The increase in real GDP in Q4 primarily reflected positive contributions from PCE, non-residential fixed investment, exports, residential fixed investment, state and local government spending, and federal government spending that were partly offset by a negative contribution from private inventory investment. Estimates of Q1 2017 GDP indicate an output close to 3% which is similar to the 2.9% gain posted in last year's Q4 2017.
For much of 2017, the 2% inflation goal remained elusive despite the tightest labor market in decades. The Consumer Price Index rose 2.4% y/y in March 2018, the largest 12-month increase since the period ending March 2017 and higher than the 1.6% average annual rate over the past 10 years. Consumer prices for food rose 1.3% y/y. Energy prices rose 7% y/y probably due to continued OPEC crude oil production discipline reducing the supply demand glut and bring the oil market into a slight deficit with global demand at 99.8 million bbls/day and supply at 97.8 million bbls/day as of the end of the quarter.
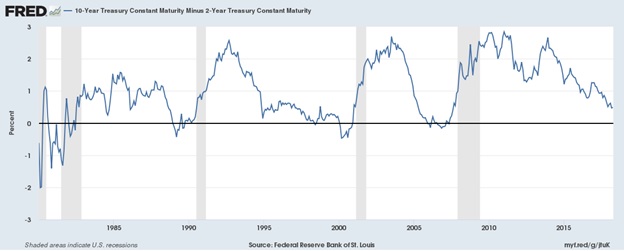
Fiscal economic boosts in this late stage of the economic cycle pose risks of faster inflation and a faster pace of Fed tightening though. Fed rate hikes, rising Labor market inflation concerns in the form of rising average hourly earnings, and trade protectionist fears are headwinds going forward. Longer-term Treasury yields have moved up and the spread between the 2 and 10 year yield has tightened.
While we believe that the tailwinds are currently stronger than the headwinds despite the spike in volatility, the headwinds are strong and could intensify as the year progresses. Central banks around the world are easing back on loose monetary policies. High corporate earnings expectations provide another source of possible volatility as earnings come in. With high expectations being priced into the market, there is less possibility of higher returns going forward.
Going forward we believe the greatest threats to the markets are the Fed raising rates faster than necessary and a full blown Trade war between the US and China beyond the current small-scale clashes. The U.S. Fed could potentially hike rates a total of four times this year. And if the trade war situation worsens we could see even more market volatility and larger risk premiums across asset classes. Both situations set up a scenario where we might be up for more turbulence in the 2nd half of the year and if unchecked, the possibility of recession late into 2019/2020.
The 10-year/2-year US Treasury spread often signals the market’s expectation of a downturn in growth. As the shorter-duration 2 year note sells off, its yield rises. As it sells off faster than the longer duration 10yr note -term securities there is a tightening of the spread. A flattening yield curve signals stalling economic growth, rising inflation, and the increasing likelihood of a near-term credit shock. Weakness in the high yield market including new junk bond offerings being scrapped indicate that the spread is tightening. A 2 yr. yield above 2% is a number to watch acutely and it currently stands at 2.39% while the 10 year yield stands at around 2.82%. A sustained tightening of the 2year spread against the 10 yr. Treasury yield could serve as a risk-off trigger for equities.
Current Portfolio Positioning
Currently, the strategy is overweight the Consumer Discretionary, Consumer Staples, Energy, Financials, Industrials, and Telecommunications sectors. We continue to believe that Financials in general should benefit from the rising interest rate environment. We also believe that Energy stocks will continue to benefit from OPEC/Russia production discipline, rising geopolitical risk in regards to Iran, and more specifically the overlooked potential of Natural gas shortages during the summer injection season due to severe depletion during the winter season, leading to a spike in the price of Natural Gas. The strategy is currently underweight the Healthcare, Information Technology, Materials, and Real Estate (REITs) sectors. A continued lack of clarity related to Health Care legislation has caused us to reduce exposure within this sector in recent months.DISCLOSURE The views expressed in this report and accompanying communication are solely the opinions of StoneRidge Investment Partners LLC (the “Firm”). Although the statements of fact and data in this report have been obtained from, and are based upon, sources that the Firm believes to be reliable, we do not guarantee their accuracy, and any such information may be incomplete or condensed. All opinions in this report and accompanying communication constitute the Firm’s judgment as of the date of this report and are subject to change without notice. This communication is intended for informational purposes only and does not constitute a solicitation to invest money nor a recommendation to buy or sell certain securities. Equity investments are not appropriate for all investors. Equity investments are not FDIC insured and may lose value. Investments in small, mid-cap and micro-cap companies involve additional risks such as limited liquidity and greater volatility. Past performance is no guarantee of future results.